Eiffel Home Page (Web) -- Getting started with Eiffel (local)

![]()
The next set of EiffelStudio capabilities enable you to control and monitor the execution of your systems. The obvious immediate application is to debugging; but the more general goal is to let you follow the execution of your systems, explore the object structures, and gain a better understanding of the software.
Before looking at debugging facilities don't forget that debugging in Eiffel is different. The presence of Design by Contract mechanisms gives the debugging process a clear sense of direction. The speed of the recompilation process makes it easy to recompile after a change; after getting rid of syntax and validity errors, you run the system again, and remaining errors are often caught as violations of contract clauses -- routine preconditions, routine postconditions, class invariants.
The facilities to be described now are also useful when you find such an error, as they will help you study its execution context. In fact, one of the characteristics of the debugging mechanism is that there is no "debugger" proper, no more than there is a "browser"; you have instead a set of facilities supporting controlled execution and debugging. This means for example that:
 While debugging, you can access all the browsing capabilities to explore the features and classes surrounding the cause of an error.
While browsing, you can launch or resume execution, and follow its progress through the debugging facilities.
If execution stops on an exception -- assertion violation, arithmetic overflow, call on a void target
…
-- you have all the environment's facilities at your disposal to understand what happened.
To control the execution you will set breakpoints, indicating places where you want to interrupt the execution. You may set a breakpoint on an individual instruction of a routine, on the routine's precondition or postcondition, or on the routine as a whole, meaning its first operation (precondition or instruction).
A group of icons on the Project Toolbar help control breakpoints. They are known in EiffelStudio terminology as " buttonholes ", meaning that they can serve both as buttons (you can click them to get some functions) and holes (you can pick-and-drop into them to get some other functions).
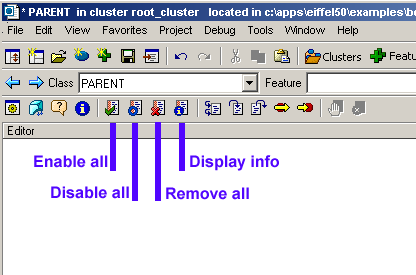
The labels correspond to the icons' use as buttons: enable all set breakpoints, disable them all, clear all, display information on current breakpoints. The difference between "disabling" and "removing" is that disabling turns off breakpoints until further notice but remembers them, so that you can later re-enable them, whereas "removing" clears them for good.
Target a Development Window to the class TESTROOT and pick-and-drop the name of the procedure make (the first routine, after the declaration of the two attributes o1 and o2 ) to the Enable all icon, used here as a hole. This sets and enables a breakpoint on the routine. Click the button labeled Display info above to get the list of breakpoints, as shown in the next figure.
If the Context Tool is not present, Display info will bring it up. You can get the same effect as that of Display info by selecting the Output Tab in the Context Tool.
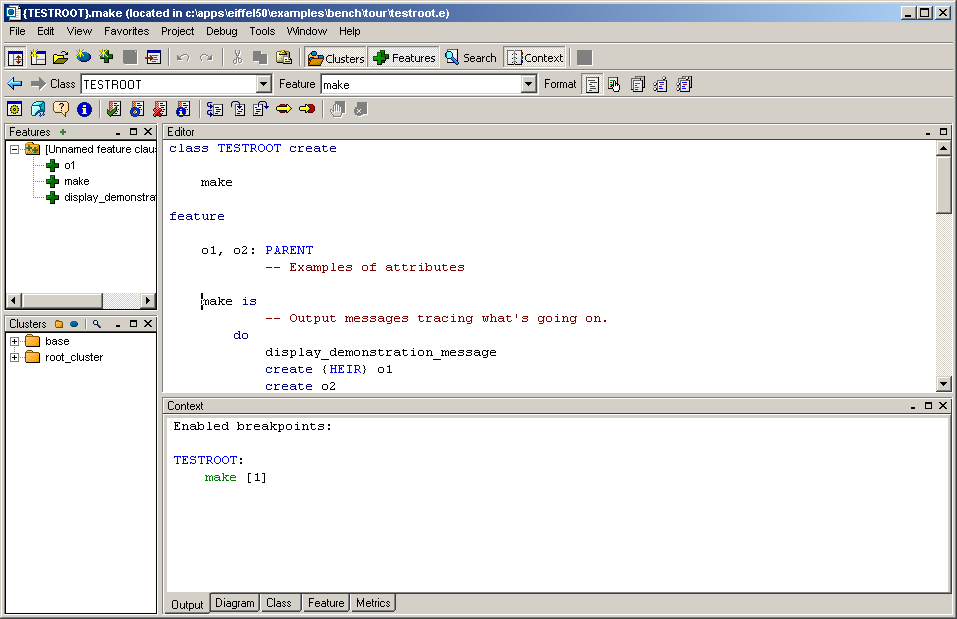
This shows that so far you have enabled only one breakpoint. For a finer degree of control, let's look at the feature's flat form. Pick-and-drop make to the Context Tool -- from the Context Tool itself, since its name appears there, or the Editing Tool); this sets the Context to the Feature Tab. Select the Flat view if that wasn't the last one used:
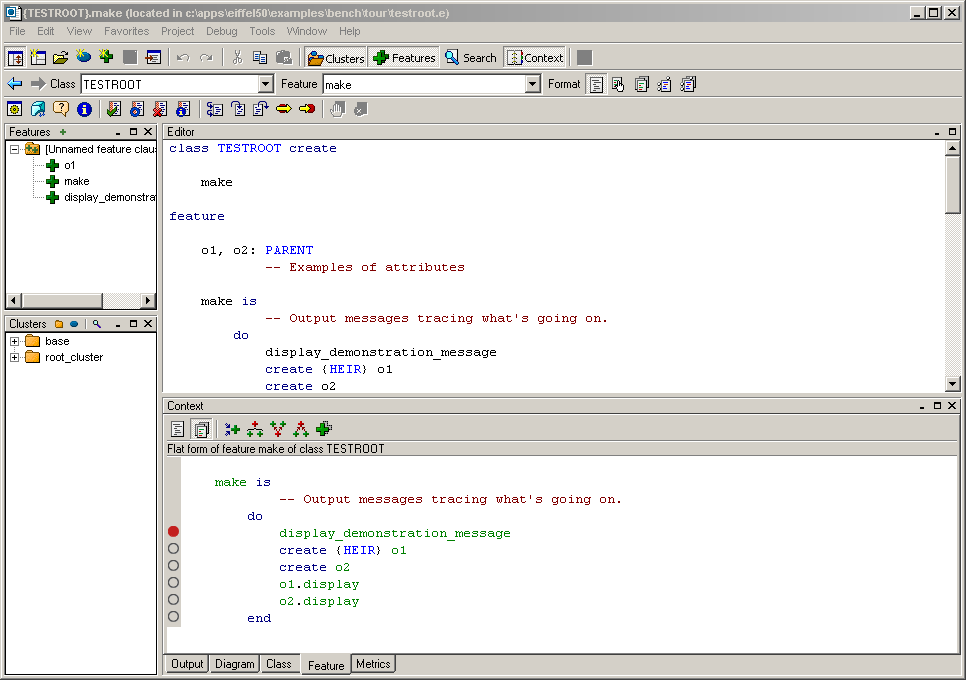
The small circles on the left side of the Flat form indicate breakpoint positions. Empty ones are not set; enabled breakpoints are marked by a circle filled with red. At the moment only one is enabled, corresponding to the first instruction of the routine since, as noted, setting a breakpoint on a routine as a whole means setting it on its first operation.
By (left) clicking on a breakpoint mark, you toggle it between enabled and not set. You can also right-click on a mark to get a menu of possibilities. Try enabling and unsetting a few of these marks; you might get something like this:
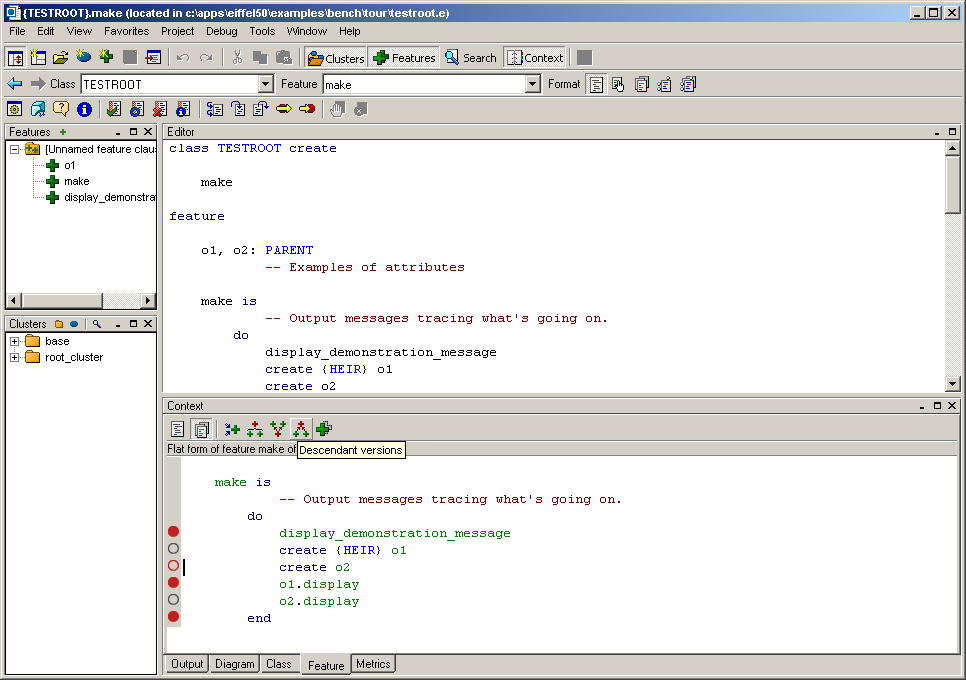
The breakpoint mark for the routine's third instruction, create o2 , is red but not filled; this means it is set but not enabled. You can obtain this by right-clicking on the mark and choosing Disable breakpoint on the menu that comes up. Any potential breakpoint will be in one of three states: not set; enabled; set but disabled.
You can see the list of enabled and disabled breakpoints by clicking the Output Tab, or the Display info button in the Project Toolbar.
For the continuation of this tour it doesn't matter which exact breakpoints of make you've set, as long as the one on its first instruction is set and enabled (red-filled circle) as above. Please make sure this is the case before proceeding.
To execute, you will use the following Run buttons in the Project toolbar, or the corresponding entries in the Debug menu:
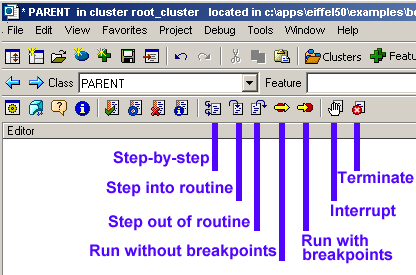
The buttons are shown here in full bloom, but at any times some of them will be grayed out. Terminate is only active when execution has started and not terminated; Interrupt is only active when the execution is active (not stopped at a breakpoint).
The Debug menu entries will also remind you of shortcuts: F10 for Step-by-step , F11 for Step into routine , Shift-F11 for Step out of routine , CTRL-F5 for Run without breakpoints , F5 for Run with breakpoints , CTRL-Shift-F5 for Interrupt , Shift-F5 for Terminate .
Start execution of the compiled system by clicking Run with breakpoints . The display automatically switches to accommodate supplementary tools providing debugging information. Execution stops on the breakpoint that you have enabled on the first instruction of procedure make :
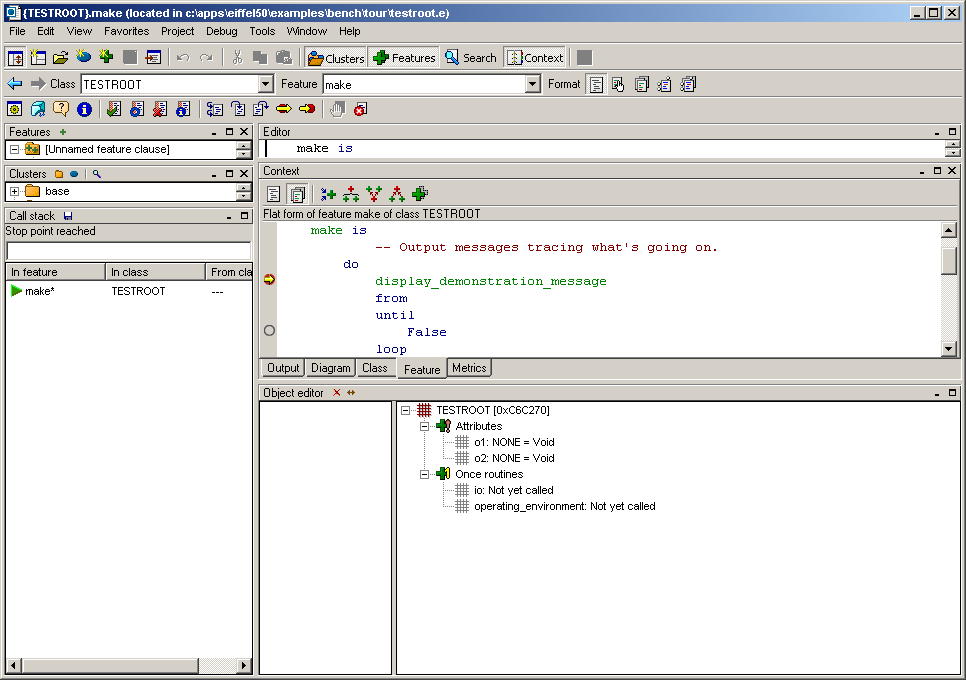
The pane at the bottom left indicates that execution has stopped in make . The Context shows the flat form of that routine, with a new icon to indicate the stop point which execution has reached. At the bottom right is a new tool, the Object Editor , which shows the content of current object and (later) related objects. At the moment you can see that:
The current object is an instance of class
TESTROOT
.
The class (as you could also see from its text in a Development Window) has two attributes
o1
and
o2
, for which the corresponding fields in the current object are both void; this is as expected since you haven't yet executed the two creation instructions
create
{
HEIR
}
o1
and
create
o2
, as they come after the breakpoint.
Along with attributes, an Eiffel class may have
once functions
, executed at most once -- the first time they are called -- in a given session, and from then on always returning the same value. Here the once function
io
has been called, returning an object of type
STD_FILES
, but
operating_environment
(coming, like
io
, from the top-level class
ANY
) has not yet been called.
The execution-time objects that you may display in an Object Editor are our latest kind of EiffelStudio "development object", along with classes, features, explanations, clusters; notice their distinctive icon, a rectangular mesh suggestion an object's division into fields. It appears colored for actual objects, gray for void references such as operating_environment.
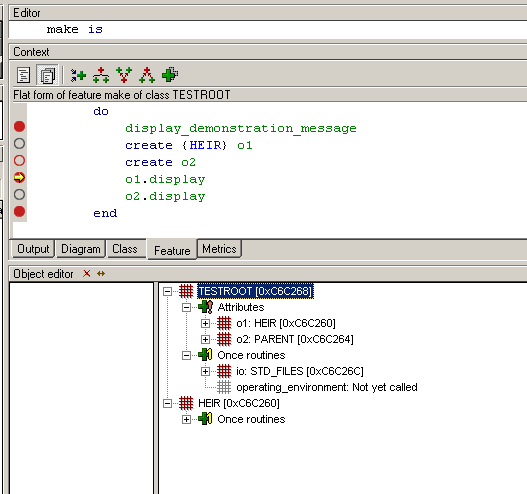
Click twice on Step-by-step (or press the function key F10 twice). Monitor, in the flat form of make , the marker that shows execution progress; note that the marker always points to the next operation to be executed. After the two steps, the Context and Object Tools look like this:
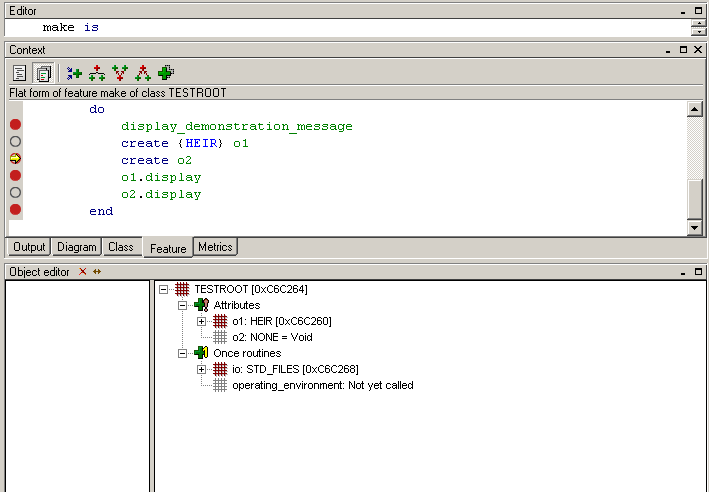
The last instruction that you executed is create { HEIR } o1 , meaning create an object and attach it to o1 , but instead of using the declared type PARENT of o1 use its proper descendant HEIR . As a result, the entry for o1 in the Object Tool no longer shows Void but an object of type HEIR . Note that all objects are identified by their addresses in hexadecimal; such an address is by itself meaningless, but enables you to see quickly whether two object references are attached to the same object. The addresses you see as you run the Guided Tour will -- except for some unlikely coincidence -- be different from the ones appearing here.
Note that since the ISE Eiffel garbage collector compacts memory and hence may move objects around, the address of a given object is not guaranteed to remain the same throughout a session.
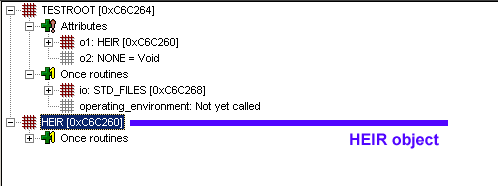
To see the details of the object, pick-and-drop its identifier in place (that is to say, drop it in the Object Tool itself). A new object entry appears, showing the object:
Now try pick-and-dropping that same object, the instance of HEIR , to the Context Tool above the Object window . The effect is the same as if you had pick-and-dropped the class name HEIR : retarget the Context Tool to that class.
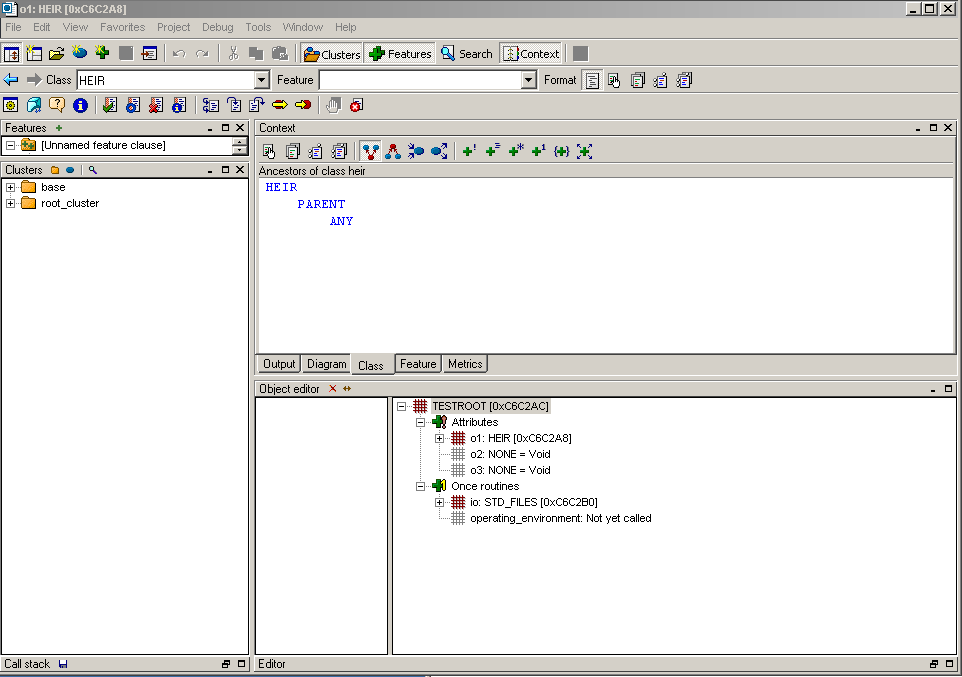
In the same way that you can drop a feature pebble into a tool that expects a class, you can also drop an object pebble, which will be understood as denoting the object's generating class.
Because the Context Tool is showing a class, it has switched to the default format for classes, Ancestors , and is showing the ancestors of HEIR . Click the Feature Tab of the Context Tool to set it back to feature information for the continuation of our debugging session. No feature is currently displayed.
Click Step-by-step once more to advance just before the call o1 . display :
Choosing Step-by-step again would execute the next step in the current routine, the call o1 . display , treating the entire execution of display from class HEIR as a single operation. Assume instead that you want to go into that routine and follow the details of its execution. For one thing, you might not know that it's a routine of class HEIR , since o1 is declared of type PARENT and it's only through polymorphism, o1 being dynamically of type HEIR at this point, and through dynamic binding, that the execution ends up calling a routine from HEIR . Of course here it's obvious because of the wording of the create a few lines up, but in many cases, especially all those for which polymorphism and dynamic binding are really interesting, the exact type won't be immediately clear from the neighboring software text.
Click the Step into routine button (or press F11). This brings execution to the beginning of the appropriate display routine in class HEIR :
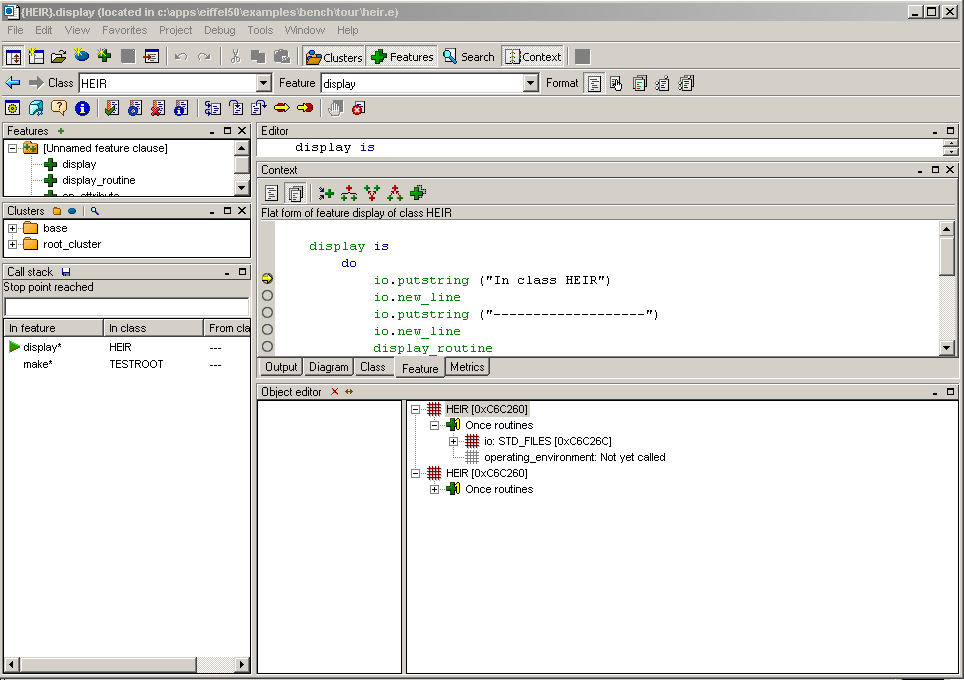
You can also expand the Call stack pane on the left to see the full call stack, consisting here of only two levels. Minimize it to get the above display back.
Now click Step out of routine (Shift-F11) to finish the execution of display . This brings you back to the next instruction of the calling routine, make of TESTROOT .
You may now click the Terminate button (Shift-F5) to end execution. The execution-specific tools go away and the display returns to what it was before execution.
In this little application nothing runs long enough to give you the time to interrupt it. In a longer-running application you may want to interrupt execution, without necessarily terminating it, while it's running (not stopped on a breakpoint). This is the purpose of the Interrupt button (CTRL-Shift-F5). It will interrupt execution at the closest potential breakpoint position, letting you -- as when execution stops because of an exception -- take advantage of all the debugging and browsing facilities to see what's going on inside the program. You may then restart execution -- with or without breakpoints, single-stepping, out of the current routine, into the next routine -- by choosing the appropriate Run button
In debugging sessions for more advanced applications, you will also find self-explanatory mechanisms enabling you, in addition to what we have seen, to examine all the objects on the "call stack": arguments and local entities of the current routine, its caller, caller's caller and so on.
The combination of these facilities provides you with a level of dynamic information on the execution of your system that matches the static information that the browsing mechanisms studied in preceding sections provide about the system's structure.
![]()
Eiffel Home Page (Web) -- Getting started with Eiffel (local)
Copyright Interactive Software Engineering, 2001